Console & Logging
IntenseRP comes with some pretty handy logging features to help you keep an eye on what's happening (and figure out what went wrong when it inevitably does). This page covers the console window, file logging, and how to export logs for debugging.
The Console Window
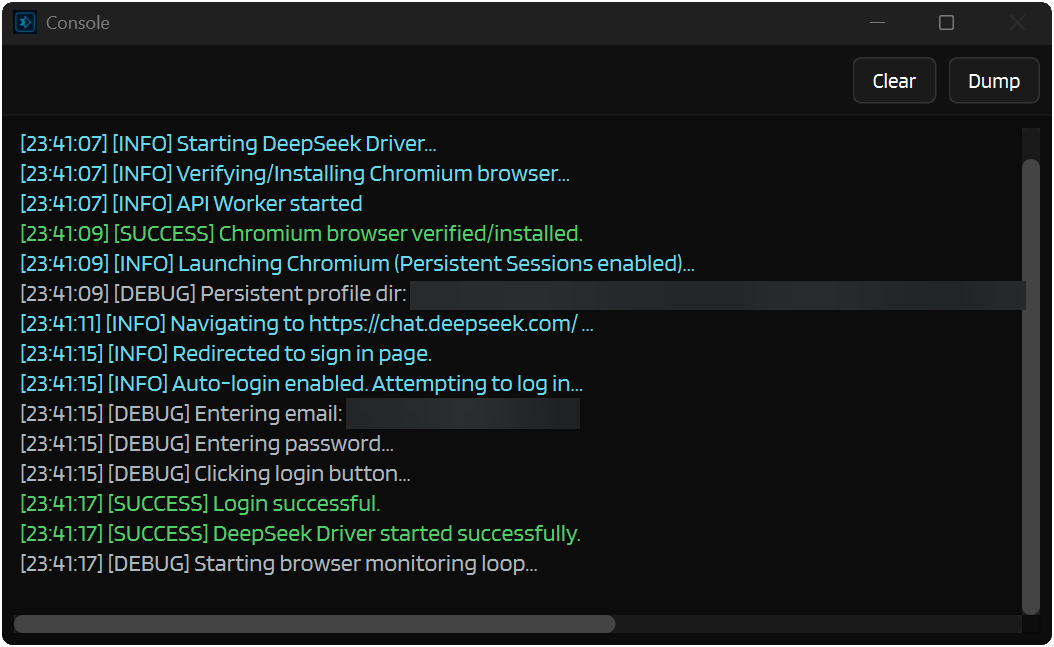
The console is a separate window that shows real-time logs with color-coded messages. Very useful for seeing what IntenseRP is up to behind the scenes.
Enabling the Console
Settings → Logs and Troubleshooting → Console Window → Open a Console Window
When you turn this on, a console window pops up showing everything happening in real-time. You can minimize it, but it won't close until you disable it in settings.
When to Use What
- Running from binaries? Use the console window or file logging as you run in GUI mode.
- Running from source? Terminal logging works great since you already have a terminal open.
Log Levels
Messages are color-coded so you can spot problems at a glance:
| Level | Color | What It Means |
|---|---|---|
| DEBUG | Gray | Detailed internal info (mostly for developers) |
| INFO | Cyan | General activity updates |
| SUCCESS | Green | Something completed successfully |
| WARNING | Yellow | Something might be off, but not critical |
| ERROR | Red | Something broke |
Color Themes
Not a fan of the default colors? Sure then, pick your poison 
Settings → Logs and Troubleshooting → Console Window → Color Theme
| Palette | Style |
|---|---|
| Modern | Softer, muted colors (the default) |
| Classic | The original IntenseRP API color scheme |
| Bright | A brighter, punchier version of Modern |
Console Appearance
Just a few more tweaks to make it your own:
| Setting | What It Does |
|---|---|
| Lines to Keep | How many lines to keep before old ones get trimmed (default: 500) |
| Text Size | Text size in the console (default: 10 but I prefer 12) |
| Wrap Lines | Soft-wrap long lines to reduce horizontal scrolling |
| Auto-Scroll | When to follow new logs: Always / Bottom only / Never |
| Keep the Console on Top | Keep the console above other windows |
Keep the Console on Top
This can sometimes cause issues on startup - the console might grab focus or get in the way. Only enable it if you really need it.
Log Routing
When the console is enabled, you get some control over where logs end up:
| Setting | What It Does |
|---|---|
| Also Show Logs in the Main Window | Shows logs in the Activity Log on the main window |
| Also Print Logs to the Terminal | Prints logs to the terminal (useful if you're running from source) |
Note
If the console is disabled, both of these are forced on so you don't miss anything important.
Logging Levels
Each output target has its own minimum severity threshold. Messages below the chosen level are silently dropped for that target, so you can keep your terminal quiet while still logging everything to a file, for example.
Settings → Logs and Troubleshooting → Logging Levels
| Setting | Controls | Default |
|---|---|---|
| Terminal | What gets printed to the terminal | Debug |
| Console Window | What appears in the console window | Debug |
| Activity Log | What shows up in the Activity Log (main window) | Success |
| Logfiles | What gets written to log files | Debug |
Severity Order
Levels are ordered from most verbose to least verbose:
Debug → Success → Info → Warning → Error
Setting a target to "Warning" means it only receives Warning and Error messages. Setting it to "Debug" means it gets everything.
Practical Defaults
The defaults are tuned so the Activity Log stays clean (no debug noise) while everything else captures full detail. If you're hunting a specific issue, try setting the relevant target to Debug temporarily.
Extra Debug Logs
Extra Debug Logs reveals additional developer-focused debug messages that are normally hidden even when your log level is set to Debug.
Settings -> Advanced -> Diagnostics -> Extra Debug Logs
Most users should leave this off. It's mainly useful when you're investigating awkward desktop behavior, provider UI weirdness, notifications, or other issues where the normal logs don't show enough detail.
Still uses your log targets
This does not change where logs go. If you want to see these messages, make sure at least one output target is set to Debug in Logs and Troubleshooting -> Logging Levels.
Review before sharing
Extra debug logs can include more internal state than the normal logs. They still go through the usual log paths, but you should review any logs or bug-report bundles before posting them publicly.
The old --extraDebugLogs launch flag still works too, but only for that run. The Settings toggle is the persistent version.
File Logging
But what if you want to keep logs for later? Enter Logfiles - IntenseRP can save logs to timestamped files for you to review or share.
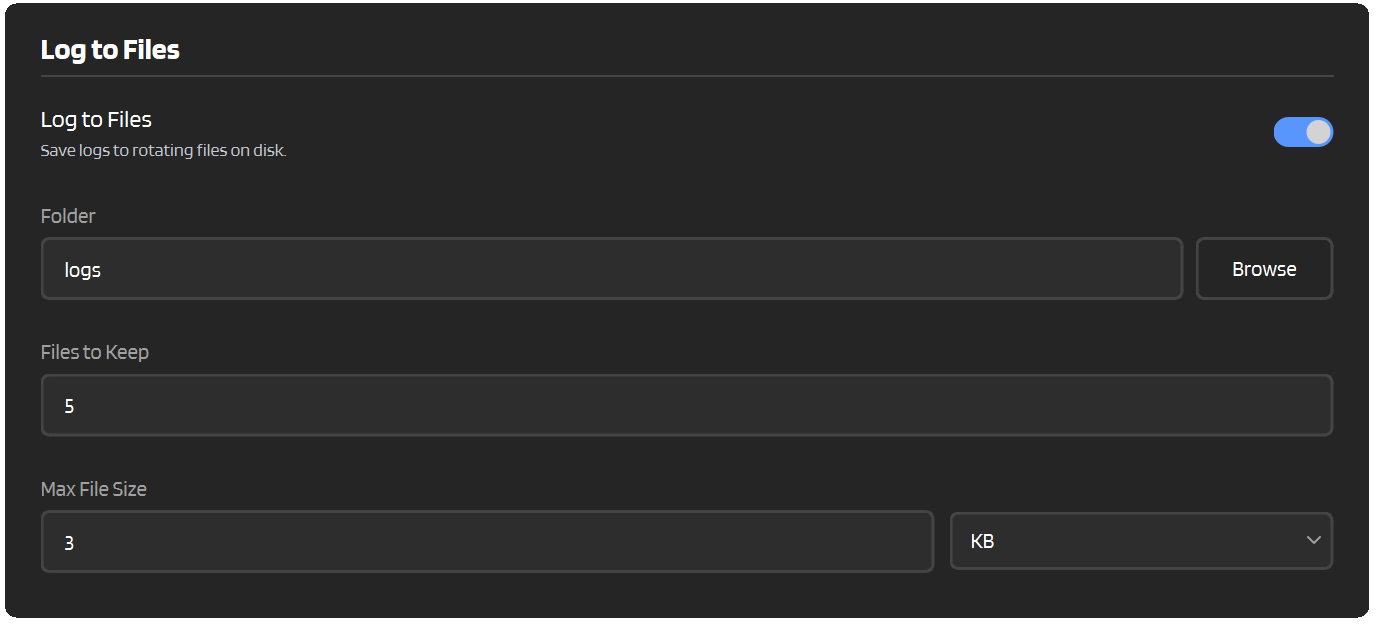
Settings → Logs and Troubleshooting → Log to Files → Log to Files
Configuration
| Setting | What It Does | Default |
|---|---|---|
| Folder | Where log files get saved | logs |
| Files to Keep | How many files to keep before deleting the oldest | 5 |
| Max File Size | Maximum size per file before it rotates | 10 MB |
How Rotation Works
When a log file hits the max size:
- The current file is closed
- Old lines get trimmed from the beginning
- If there are too many files, the oldest one is deleted
This keeps logs from growing indefinitely and eating up your disk space.
Log File Names
Files get timestamped names:
Export and Cleanup
Sometimes you need to save whatever's currently in the console - maybe to share with someone or just review later. That's what dumping is for.
How to Dump
- Open the console window
- Hit the Dump button in the top-right corner
- Pick a directory (or it'll use your default dump directory)
- Done! A file appears with a timestamp:
condump_2100-01-01_00-00-01.txt
Dump Settings
Settings → Logs and Troubleshooting → Export and Cleanup
| Setting | What It Does |
|---|---|
| Ask Before Clearing the Console | Ask before clearing the console (on by default) |
| Export Folder | Default folder for dumps (leave blank to ask each time) |
Bug Report Bundles
This is off by default and requires opt-in
The Bug Report feature is disabled by default. You have to enable it in settings to start generating bug report bundles. The internal log and prompt snapshots are NEVER saved with these disabled, and are automatically deleted when you turn the feature off.
If you want something a little more structured than manually collecting logs, there is now a dedicated Bug Report tool in Help & Extras.
It can bundle together:
- a private internal diagnostics log
- the latest saved prompt snapshots
- a
latest-prompt.txtshortcut for the newest saved prompt - metadata files with timestamps
Settings -> Logs and Troubleshooting -> Bug Reports
The Bug Report settings are off by default. You have to opt in to:
- Keep an Internal Log
- Also Save the Last Prompt
Separate from normal logfile settings
The private internal diagnostics log is its own thing. It does not depend on the console window or normal Log to Files being enabled.
Privacy and redaction
The bug-report log tries to redact a few common sensitive details automatically before it gets written to disk:
- full URLs are reduced to the scheme + domain
- email addresses become labels like
[email 1] - API key names become
[API key name] - IPv4 addresses become
XXX.XXX.XXX.XXXwhile keeping ports
That helps, but it does not make the bundle safe by default. Prompt snapshots are still prompt snapshots, and system paths can still reveal usernames or folder structures. Always review the contents of a bug report bundle before sharing it, and redact anything you don't want to share.
Where to find it
- Click Tools
- Click Bug Report
- Pick where to save the
.zip
Troubleshooting with Logs
When things go sideways, logs are your best friend. Usually that's where you'll be going to figure out what went wrong.
Want a full troubleshooting checklist?
See Troubleshooting for common fixes and how to file a good bug report.
What to Look For
- ERROR messages - Usually tell you exactly what blew up
- WARNING messages - Might hint at the root cause
- Timing - When did it break? What happened right before?
Sharing Logs
If you need to share logs with the developer or community:
- Create a Bug Report zip, dump the console, or grab the log file
- Review the contents before sharing (see the big scary warning below)
- Upload to a paste service or attach to your bug report on GitHub (pretty sure it can handle 15kb of text)
Review Before Sharing!
Log files, console dumps, and bug-report bundles can contain sensitive stuff:
- Your provider email address (shows up during auto-login)
- Your selected startup profile/account (logged when services launch, with
[PINNED]if that startup pick was pinned) - File paths that might reveal your username or folder structure
- Message content in debug logs or saved prompt snapshots
- API keys if you're debugging auth issues
Always check and redact any personal info before sharing logs publicly!
Common Error Patterns
Browser won't launch
Look for errors mentioning:
Failed to launch- Browser installation issuechromiumorplaywright- Missing browser componentsENOENT- File or directory not found
Login failing
Look for:
sign_in- Being redirected to login pageError during auto-login- Credential or form problems- Timeout errors - Page not loading fast enough
Request errors
Look for:
HTTPstatus codes (401, 403, 500, etc.)Connection refused- Server not reachableTimeout- Request took too long
Quick Reference
Console Settings
| Setting | Default | What It Does |
|---|---|---|
| Open a Console Window | Off | Shows the console window |
| Also Show Logs in the Main Window | On | Shows logs in main window |
| Also Print Logs to the Terminal | On | Prints to terminal |
| Lines to Keep | 500 | Lines before trimming |
| Text Size | 10 | Console text size |
| Wrap Lines | Off | Soft-wrap long lines |
| Auto-Scroll | Always | Auto-scroll behavior |
| Color Theme | Modern | Color scheme |
| Keep the Console on Top | Off | Keeps console above other windows |
Logging Levels
| Setting | Default | What It Does |
|---|---|---|
| Terminal | Debug | Minimum severity for terminal output |
| Console Window | Debug | Minimum severity for the console window |
| Activity Log | Success | Minimum severity for the Activity Log |
| Logfiles | Debug | Minimum severity for log files |
Logfiles
| Setting | Default | What It Does |
|---|---|---|
| Log to Files | Off | Saves logs to files |
| Folder | logs |
Where files go |
| Files to Keep | 5 | Files before rotation |
| Max File Size | 10 MB | Size before rotation |
Export and Cleanup
| Setting | Default | What It Does |
|---|---|---|
| Ask Before Clearing the Console | On | Ask before clearing |
| Export Folder | (blank) | Default dump location |
Advanced Diagnostics
| Setting | Default | What It Does |
|---|---|---|
| Extra Debug Logs | Off | Reveals additional developer-focused debug messages |